Double bottom is a Bullish Reversal Pattern that is used in Technical analysis to look for signals of a trend shift, from a downtrend to an Uptrend or from a bearish trend to a bullish trend. This pattern is the Opposite of the Double-top pattern.
How to Trade the Pattern:
Once the price breaks above the neckline, traders look for a buying opportunity. The expected upward move is approximately equal to the distance from the top and bottom of the pattern. Stop-Loss is placed below the second bottom to limit downside risk.
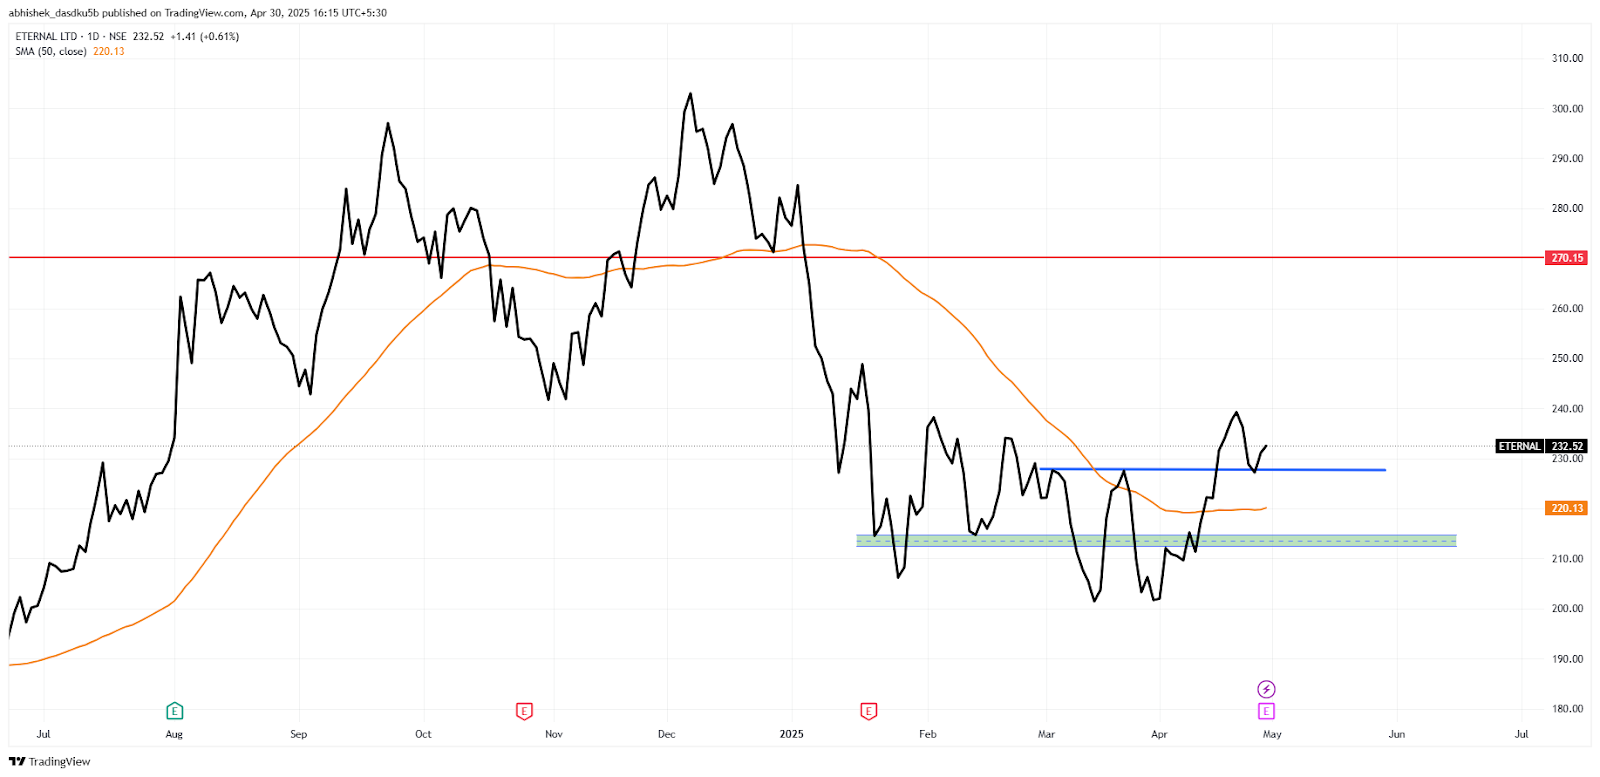
The Breakout Level for the Double Bottom is Rs. 228, and the stock is currently trading close to the breakout level at 232. The resistance level for the stock is around Rs 270 levels. And the Nearest support zone for the stock is Rs. 212 to 214.
About the Company
Zomato Limited is one of India’s leading online food delivery and restaurant discovery platforms. Founded in 2008 by Deepinder Goyal and Pankaj Chaddah, Zomato started as a restaurant search and review website but has since evolved into a major player in the country’s growing online food delivery ecosystem. Today, its main business segments include food delivery, dining-out services, and quick commerce.
Zomato Limited has recently announced that it will change its corporate name to Eternal Limited, marking a shift to reflect its growing presence beyond just food delivery.
Written By Abhishek Das
Disclaimer

The views and investment tips expressed by investment experts/broking houses/rating agencies on tradebrains.in are their own, and not that of the website or its management. Investing in equities poses a risk of financial losses. Investors must therefore exercise due caution while investing or trading in stocks. Dailyraven Technologies or the author are not liable for any losses caused as a result of the decision based on this article. Please consult your investment advisor before investing.
The post Zomato is forming bullish pattern on its Daily Chart; Check key support and resistance levels appeared first on Trade Brains.
Double bottom is a Bullish Reversal Pattern that is used in Technical analysis to look for signals of a trend shift, from a downtrend to an Uptrend or from a bearish trend to a bullish trend. This pattern is the Opposite of the Double-top pattern. How to Trade the Pattern: Once the price breaks above
The post Zomato is forming bullish pattern on its Daily Chart; Check key support and resistance levels appeared first on Trade Brains. Read MoreNews, Stocks, market news, stock market, Stock market news, stock news Trade Brains