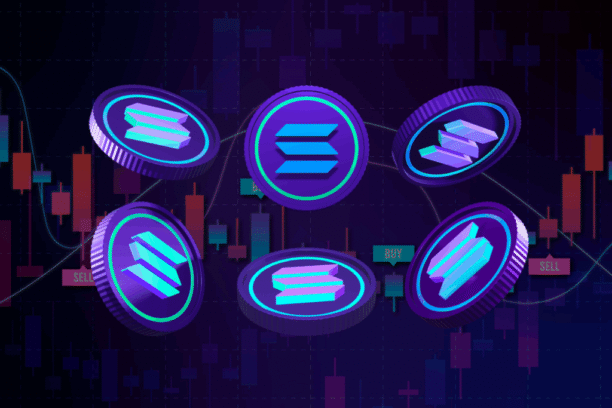
After a period of consolidation, Solana’s price has experienced a significant decline, trading below $150. This downturn coincides with a broader market sell-off triggered by Israel’s recent airstrike on Iranian nuclear facilities. The strike led to a ripple effect across global financial markets, including cryptocurrencies.
As Solana approaches key support levels, investors are closely monitoring its price action to assess whether it can stabilise or if further declines are imminent.
At the time of writing, Solana is trading at $145.6, down by 9%, in the past 24 hours. Along with this price action, the total market cap of Solana reached $76.29 billion, with a 24-hour trading volume of $6.71 billion.
In this overview, we will analyse the key technical levels and trend directions for Solana to monitor in the upcoming trading sessions. The chart mentioned below is based on the 15-minute timeframe.
Solana Chart Analysis & SOLUSD Price Action.

Solana is experiencing a consolidation and is currently trading at $145.6. If the price fails to hold the first level of support at $140.8, we could witness the start of a bearish trend. The next level of support to watch is at $132.3, which is crucial for maintaining a bullish outlook. If the price cannot sustain above this level, a deeper correction could take place, potentially leading to a free fall toward the next support at $124.2, which would mark a significant drop.
On the other hand, if Solana finds buying strength and the price starts moving upwards, we can identify several key resistance levels that traders should monitor. The first level of resistance is around $153.3, closely followed by $161.00 and then $168.3. If the price breaks through these resistance levels with strong momentum, it would suggest further upward movement and potentially indicate that Solana is in a stronger bullish trend.
In Closing
Solana is currently experiencing a strong downtrend phase after a strong rally towards its recent highs. If it manages to surpass the current resistance levels, this could trigger a more substantial upward trend. In the short term, we may observe a sideways market as the cryptocurrency seeks new support levels.
However, the market may enter a bearish period with more downward swings probable if the barrier levels hold.
Depending on how the price moves around these critical support and resistance levels, traders should keep a careful eye on them as they offer possible entry chances for both long and short positions.
The post Solana Breaks Bullish Momentum — Can Key Support Hold? appeared first on Trade Brains.
After a period of consolidation, Solana’s price has experienced a significant decline, trading below $150. This downturn coincides with a broader market sell-off triggered by Israel’s recent airstrike on Iranian nuclear facilities. The strike led to a ripple effect across global financial markets, including cryptocurrencies. As Solana approaches key support levels, investors are closely monitoring
The post Solana Breaks Bullish Momentum — Can Key Support Hold? appeared first on Trade Brains. Read MoreCrypto, Digital Assets, News, crypto, Solana Trade Brains