WASHINGTON, May 15, 2025 (GLOBE NEWSWIRE) — Key Highlights
- The U.S. housing market still needs 367,000 more home listings at a maximum price of $170,000, 416,000 more priced at or below $255,000 and 364,000 more priced under $340,000.
- For the U.S. housing supply, a sizable amount (44%) of the 100 largest metropolitan areas is classified as “Areas Stuck in the Middle,” 30% as “Areas Getting Closer to Balance” and 26% as “Areas Falling Further Behind.”
- Montana, Idaho, California, Massachusetts and Hawaii have the largest shortfalls in affordable housing.
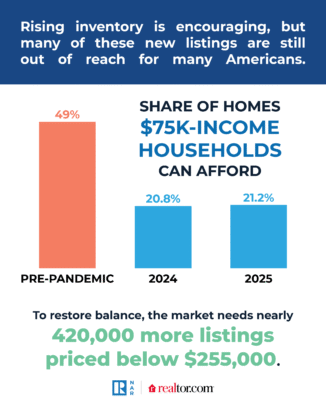
U.S. households earning $75,000 a year can only afford 21.2% of home listings as of March 2025 – up slightly from 20.8% a year prior and representing the biggest gain of any income group – demonstrating that the nation’s housing affordability gap persists, according to the National Association of Realtors® and Realtor.com® 2025 Housing Affordability & Supply report.
The report analyzes the shortage of affordable homes across different income levels in the current U.S. housing market. It provides a real-time, income-specific snapshot of housing affordability, examining what home buyers at various income levels can afford based on standard lending criteria.
For-sale housing inventory increased nearly 20% nationwide in March 2025 from one year earlier, and while this gain marks progress, it remains far from pre-pandemic conditions.
“The housing market is at a turning point,” said Nadia Evangelou, NAR senior economist and director of real estate research. “More homes are hitting the market, and it’s encouraging to see the greatest housing-supply gains among middle-income home buyers.”
While households earning $75,000 a year experienced a slight improvement in accessibility to home listings between March 2025 (21.2%) and March 2024 (20.8%), the largest gain of any income group, they have less than half of the access to affordable homes than they had before the pandemic, when nearly 49% of listings were accessible. In a balanced housing market – where listings are aligned with what households at various income levels can afford – these home buyers would need access to 48.1% of listings. To reach that threshold, the market needs nearly 416,000 more listings priced at or below $255,000.
Households that earn $100,000 annually are in a similar situation. They can currently afford 37.1% of home listings, up slightly from 36.9% in March 2024. That is far below the 64.7% they could afford in 2019 and well below the 60.7% target for market balance. This group faces a shortage of nearly 364,000 home listings priced under $340,000.
A household earning $50,000 annually can only afford 8.7% of home listings today, down from 9.4% one year ago. These low-income households represent one-in-three households, …
Full story available on Benzinga.com
WASHINGTON, May 15, 2025 (GLOBE NEWSWIRE) — Key Highlights
- The U.S. housing market still needs 367,000 more home listings at a maximum price of $170,000, 416,000 more priced at or below $255,000 and 364,000 more priced under $340,000.
- For the U.S. housing supply, a sizable amount (44%) of the 100 largest metropolitan areas is classified as “Areas Stuck in the Middle,” 30% as “Areas Getting Closer to Balance” and 26% as “Areas Falling Further Behind.”
- Montana, Idaho, California, Massachusetts and Hawaii have the largest shortfalls in affordable housing.
U.S. households earning $75,000 a year can only afford 21.2% of home listings as of March 2025 – up slightly from 20.8% a year prior and representing the biggest gain of any income group – demonstrating that the nation’s housing affordability gap persists, according to the National Association of Realtors® and Realtor.com® 2025 Housing Affordability & Supply report.
The report analyzes the shortage of affordable homes across different income levels in the current U.S. housing market. It provides a real-time, income-specific snapshot of housing affordability, examining what home buyers at various income levels can afford based on standard lending criteria.
For-sale housing inventory increased nearly 20% nationwide in March 2025 from one year earlier, and while this gain marks progress, it remains far from pre-pandemic conditions.
“The housing market is at a turning point,” said Nadia Evangelou, NAR senior economist and director of real estate research. “More homes are hitting the market, and it’s encouraging to see the greatest housing-supply gains among middle-income home buyers.”
While households earning $75,000 a year experienced a slight improvement in accessibility to home listings between March 2025 (21.2%) and March 2024 (20.8%), the largest gain of any income group, they have less than half of the access to affordable homes than they had before the pandemic, when nearly 49% of listings were accessible. In a balanced housing market – where listings are aligned with what households at various income levels can afford – these home buyers would need access to 48.1% of listings. To reach that threshold, the market needs nearly 416,000 more listings priced at or below $255,000.
Households that earn $100,000 annually are in a similar situation. They can currently afford 37.1% of home listings, up slightly from 36.9% in March 2024. That is far below the 64.7% they could afford in 2019 and well below the 60.7% target for market balance. This group faces a shortage of nearly 364,000 home listings priced under $340,000.
A household earning $50,000 annually can only afford 8.7% of home listings today, down from 9.4% one year ago. These low-income households represent one-in-three households, …
Full story available on Benzinga.com
WASHINGTON, May 15, 2025 (GLOBE NEWSWIRE) — Key Highlights
The U.S. housing market still needs 367,000 more home listings at a maximum price of $170,000, 416,000 more priced at or below $255,000 and 364,000 more priced under $340,000.
For the U.S. housing supply, a sizable amount (44%) of the 100 largest metropolitan areas is classified as “Areas Stuck in the Middle,” 30% as “Areas Getting Closer to Balance” and 26% as “Areas Falling Further Behind.”
Montana, Idaho, California, Massachusetts and Hawaii have the largest shortfalls in affordable housing.
U.S. households earning $75,000 a year can only afford 21.2% of home listings as of March 2025 – up slightly from 20.8% a year prior and representing the biggest gain of any income group – demonstrating that the nation’s housing affordability gap persists, according to the National Association of Realtors® and Realtor.com® 2025 Housing Affordability & Supply report.
The report analyzes the shortage of affordable homes across different income levels in the current U.S. housing market. It provides a real-time, income-specific snapshot of housing affordability, examining what home buyers at various income levels can afford based on standard lending criteria.
For-sale housing inventory increased nearly 20% nationwide in March 2025 from one year earlier, and while this gain marks progress, it remains far from pre-pandemic conditions.
“The housing market is at a turning point,” said Nadia Evangelou, NAR senior economist and director of real estate research. “More homes are hitting the market, and it’s encouraging to see the greatest housing-supply gains among middle-income home buyers.”
While households earning $75,000 a year experienced a slight improvement in accessibility to home listings between March 2025 (21.2%) and March 2024 (20.8%), the largest gain of any income group, they have less than half of the access to affordable homes than they had before the pandemic, when nearly 49% of listings were accessible. In a balanced housing market – where listings are aligned with what households at various income levels can afford – these home buyers would need access to 48.1% of listings. To reach that threshold, the market needs nearly 416,000 more listings priced at or below $255,000.
Households that earn $100,000 annually are in a similar situation. They can currently afford 37.1% of home listings, up slightly from 36.9% in March 2024. That is far below the 64.7% they could afford in 2019 and well below the 60.7% target for market balance. This group faces a shortage of nearly 364,000 home listings priced under $340,000.
A household earning $50,000 annually can only afford 8.7% of home listings today, down from 9.4% one year ago. These low-income households represent one-in-three households, …Full story available on Benzinga.com Read MoreNWS, Economics, Markets, Analyst Ratings, Press Releases Markets