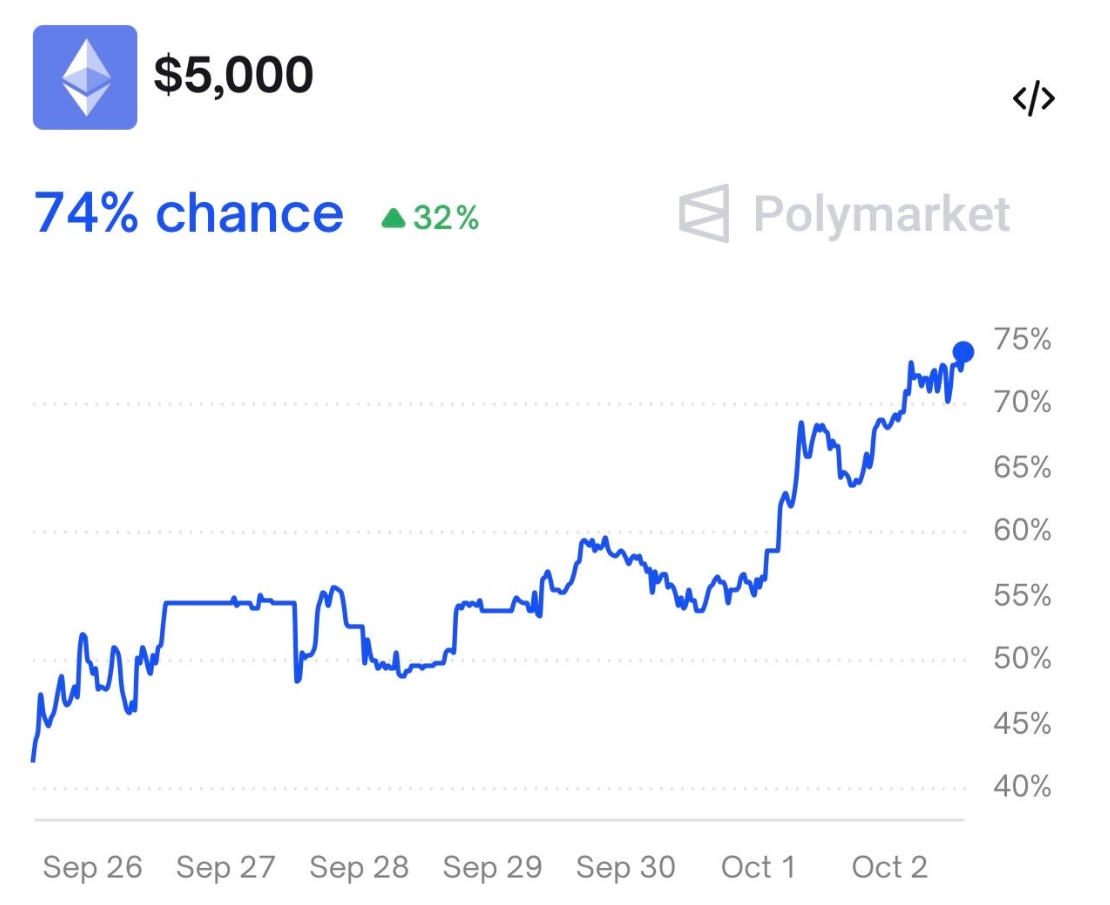
PolyMarket data shows Ethereum’s $5K year-end odds rising to 74%, up 32% from late September.
ETH price trades at $4,481 after rebounding from the $3,800–$3,900 support zone in late September.
The chart pattern forms a symmetrical triangle, projecting a breakout move toward the $5,000 resistance level.
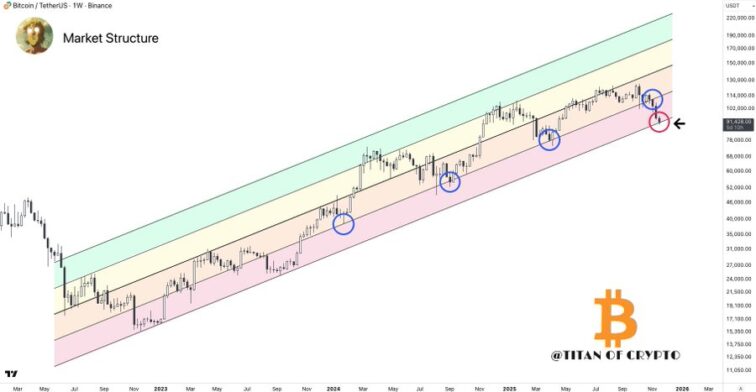
As Bitcoin broke the $115K resistance to a new weekly high of $120K, Ethereum, the second leading asset in market cap terms, is also eyeing a new market price. On August 25, ETH unlocked a new ATH of $4953.73, unable to unlock the $5000 level that many anticipated. However, market analysts have hinted at a renewed bull move, which may lead to a rally towards $5K.
Ethereum Hits 74% Odds of Reaching $5K by Year-End
PolyMarket data, a gambling platform, has recorded a 74% probability that Ethereum is likely to unlock the $5K target. According to an X post by CryptoGucci, it is seen that as of October 2, the probability stands at 74%, marking a 32% increase from prior levels. The data shows steady gains beginning September 26, when chances were near the 40% range. Through September 27 and 28, the readings moved sideways between 50% and 55% before dipping slightly.
Source: X
On September 29, the line steadied near 55% before another decline took it closer to 50%. September 30 displayed mixed movement with fluctuations, but maintained levels largely above 50%. On October 1, the readings jumped from the mid-50% range to more than 65% by late session. The rise extended into October 2, with probabilities climbing past 70% and closing near the 75% mark.
The chart confirms a strong upward trend from late September lows near 40% to early October highs. Across the seven-day period, Ethereum’s $5,000 year-end target probability gained over 30 percentage points in momentum. The latest value at 74% represents the strongest reading since tracking began in late September.
Does This Price Structure Validate a Move Towards $5K?
As many people expect a new ATH, an observation by Ash Crypto reveals that Ethereum’s daily chart showAs the price trading at $4,481 after gaining +3.00% in the latest session. The current candle reflects a rebound that began after retesting the $3,800–$3,900 support zone in late September. From that level, Ethereum reversed strongly and advanced through resistance, confirming higher lows inside the drawn triangular structure.
Source: X
The chart indicates price movement compressing within converging trendlines since August, forming a symmetrical triangle pattern. Recent price action shows Ethereum breaking upward from this formation, pushing through $4,400 and now holding above $4,480. The structure projects a continuation, marking $5,000 as the next target following the breakout from the structure. Price levels between $4,350 and $4,500 have acted as current resistance during early October trading sessions.
Earlier candles in September show repeated rejections near the descending trendline drawn from August highs around $4,800. The retest and rebound above $3,800 confirmed the base before Ethereum advanced back into the triangle’s upper range. The projected trajectory on the chart points toward a climb, stretching toward the $5,000 level in the near term. This projection from the $4,481 trading level outlines the next marked stop at $5,000 as illustrated. Read MoreNews, Market Analysis, Market News, NewsNow, Altcoin, Crypto market, cryptocurrency, Ethereum Cryptonewsland – Your Daily Crypto News