Bitcoin is trading confidently above the $100,000 mark, having recently marked a local high near $104,300. After months of choppy action and uncertainty, bulls are now firmly in control, reigniting momentum across the broader crypto market. As BTC retests key supply levels last seen near the previous all-time high, optimism is building that this breakout could be the beginning of a sustained move higher.
The entire market appears to be waking up, with altcoins following Bitcoin’s lead and liquidity flowing back into risk assets. Traders are watching closely to see if BTC can maintain this strength and convert $100K into solid support.
Top analyst Big Cheds shared a technical update highlighting the current 4-hour chart structure, noting that BTC is exhibiting a bullish consolidation. This pattern typically signals continuation, as price compresses just below resistance before attempting a breakout. With no signs of exhaustion yet, the setup suggests that Bitcoin may have more room to run, especially if bulls can maintain momentum through the weekend.
Bitcoin Tests Key Resistance Amid Bullish Momentum
Bitcoin has surged with strength over the past few days, breaking through multiple resistance levels and reclaiming the $100K mark with conviction. Now trading near $104,000, BTC is facing a critical resistance zone that could determine whether the rally continues toward new all-time highs—or pauses for consolidation. This level coincides with the upper boundary of a previous supply zone and has become a focal point for both bulls and bears.
While price action remains clearly bullish, macroeconomic conditions still pose risks. Persistent global uncertainty, concerns about inflation, and tight monetary policies from central banks could weigh on risk assets in the short term. If sentiment shifts or external shocks hit the market, Bitcoin may experience a pullback despite the strong structure it’s built recently.
Cheds offered insights into Bitcoin’s current setup, highlighting that the 4-hour chart is showing a “high and tight” bullish consolidation—a classic continuation pattern. According to Cheds, this formation reflects strength, as BTC consolidates at elevated levels rather than pulling back, suggesting that buyers remain in control and are absorbing any sell pressure.
If Bitcoin can push above the $104K mark with volume, the next logical target would be a retest of the previous all-time high around $109K. However, traders should remain cautious. Despite the bullish technical setup, short-term volatility and external market risks could lead to sudden reversals.
For now, Bitcoin holds a bullish bias, and as long as it continues consolidating above $100K, the case for a continuation higher remains intact. The next few sessions will be crucial in determining whether BTC has the strength to break out or needs more time to build.
Price Analysis: Forming A Bullish Structure
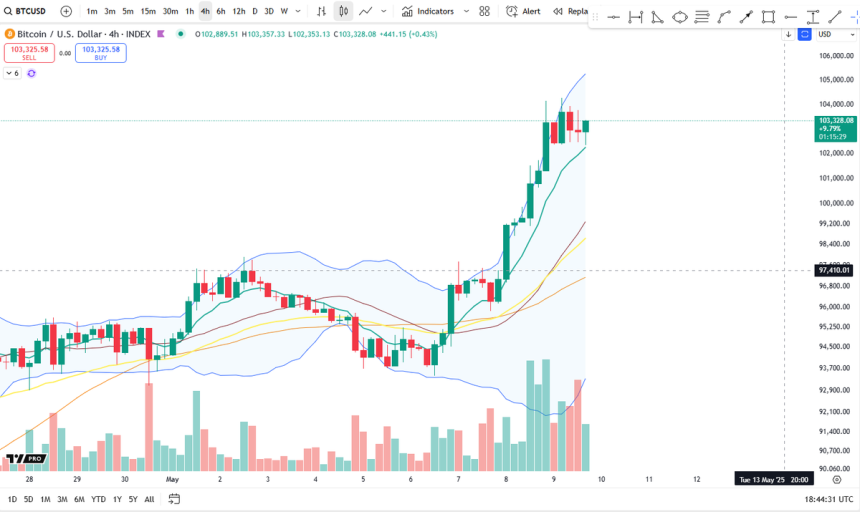
Bitcoin is currently trading just above $103,000, consolidating after tagging the $104,300 level earlier in the day. The price action confirms that bulls are firmly in control, having reclaimed the $100K level with strength and cleared multiple layers of resistance. However, the chart shows that BTC is now testing a major supply zone between $103K and $103.6K — a level that previously acted as resistance in January and February.

Volume has spiked in recent days, signaling strong demand behind this breakout. Still, the latest candle shows a long upper wick, hinting at some short-term selling pressure as BTC faces overhead resistance. If bulls manage to push above $103.6K with sustained volume, a breakout toward the $109K all-time high could follow.
On the downside, the $100K level now acts as immediate support. Below that, the $95K and $90K zones — previously consolidation areas — could offer additional structural backing. The daily 200-day simple moving average (SMA) at $91,227 and the 200-day exponential moving average (EMA) at $87,004 remain well below the current price, reinforcing the strong bullish trend.
Featured image from Dall-E, chart from TradingView
Bitcoin is trading confidently above the $100,000 mark, having recently marked a local high near $104,300. After months of choppy action and uncertainty, bulls are now firmly in control, reigniting momentum across the broader crypto market. As BTC retests key supply levels last seen near the previous all-time high, optimism is building that this breakout could be the beginning of a sustained move higher. Related Reading: Bitcoin Whale Entry Prices Diverge Sharply – Confidence Builds At Higher Levels The entire market appears to be waking up, with altcoins following Bitcoin’s lead and liquidity flowing back into risk assets. Traders are watching closely to see if BTC can maintain this strength and convert $100K into solid support. Top analyst Big Cheds shared a technical update highlighting the current 4-hour chart structure, noting that BTC is exhibiting a bullish consolidation. This pattern typically signals continuation, as price compresses just below resistance before attempting a breakout. With no signs of exhaustion yet, the setup suggests that Bitcoin may have more room to run, especially if bulls can maintain momentum through the weekend. Bitcoin Tests Key Resistance Amid Bullish Momentum Bitcoin has surged with strength over the past few days, breaking through multiple resistance levels and reclaiming the $100K mark with conviction. Now trading near $104,000, BTC is facing a critical resistance zone that could determine whether the rally continues toward new all-time highs—or pauses for consolidation. This level coincides with the upper boundary of a previous supply zone and has become a focal point for both bulls and bears. While price action remains clearly bullish, macroeconomic conditions still pose risks. Persistent global uncertainty, concerns about inflation, and tight monetary policies from central banks could weigh on risk assets in the short term. If sentiment shifts or external shocks hit the market, Bitcoin may experience a pullback despite the strong structure it’s built recently. Cheds offered insights into Bitcoin’s current setup, highlighting that the 4-hour chart is showing a “high and tight” bullish consolidation—a classic continuation pattern. According to Cheds, this formation reflects strength, as BTC consolidates at elevated levels rather than pulling back, suggesting that buyers remain in control and are absorbing any sell pressure. If Bitcoin can push above the $104K mark with volume, the next logical target would be a retest of the previous all-time high around $109K. However, traders should remain cautious. Despite the bullish technical setup, short-term volatility and external market risks could lead to sudden reversals. For now, Bitcoin holds a bullish bias, and as long as it continues consolidating above $100K, the case for a continuation higher remains intact. The next few sessions will be crucial in determining whether BTC has the strength to break out or needs more time to build. Related Reading: Ethereum Breaks Key Resistance In One Massive Move – Higher High Confirms Momentum Price Analysis: Forming A Bullish Structure Bitcoin is currently trading just above $103,000, consolidating after tagging the $104,300 level earlier in the day. The price action confirms that bulls are firmly in control, having reclaimed the $100K level with strength and cleared multiple layers of resistance. However, the chart shows that BTC is now testing a major supply zone between $103K and $103.6K — a level that previously acted as resistance in January and February. Volume has spiked in recent days, signaling strong demand behind this breakout. Still, the latest candle shows a long upper wick, hinting at some short-term selling pressure as BTC faces overhead resistance. If bulls manage to push above $103.6K with sustained volume, a breakout toward the $109K all-time high could follow. Related Reading: Cardano Approaches Critical Resistance – Break Above Could Trigger Move To $0.80 On the downside, the $100K level now acts as immediate support. Below that, the $95K and $90K zones — previously consolidation areas — could offer additional structural backing. The daily 200-day simple moving average (SMA) at $91,227 and the 200-day exponential moving average (EMA) at $87,004 remain well below the current price, reinforcing the strong bullish trend. Featured image from Dall-E, chart from TradingView Read MoreBitcoin News, bitcoin, bitcoin analysis, Bitcoin Bull Cycle, Bitcoin news, bitcoin price, Bitcoin price chart, btc, BTCUSDT
NewsBTC